

DeepDive Week 13, 2025: Rally from oversold zone. SmallCap and Midcap Indices look weak. Large Caps are attracting capital to shield from market volatility.
Disclaimer: Information and resources shared on this website are only for educational and learning of our readers/members. They should never be interpreted as a buy/sell recommendation of any asset/stock. We encourage you to do your own research and due diligence.
Week 13: 24th - 28th March, 2025
TABLE OF CONTENTS
Major Global Indices
S&P500
Bitcoin
US Dollar Index (DXY)
Indian Indices
Nifty50
Nifty500
Midcap Index
SmallCap Index
Market Breadth of Indian Stock Market
Sectoral Indices
Winning Stocks
What should traders do in this market scenario?
GLOBAL INDICES
Every trader should accept that charts ultimately speak the truth. The global cues are also hidden in the price action of major global indices. Therefore, before we look at the Indian stock market scenario, it’s important to see what happened in the Major Global Indices, during the week:-
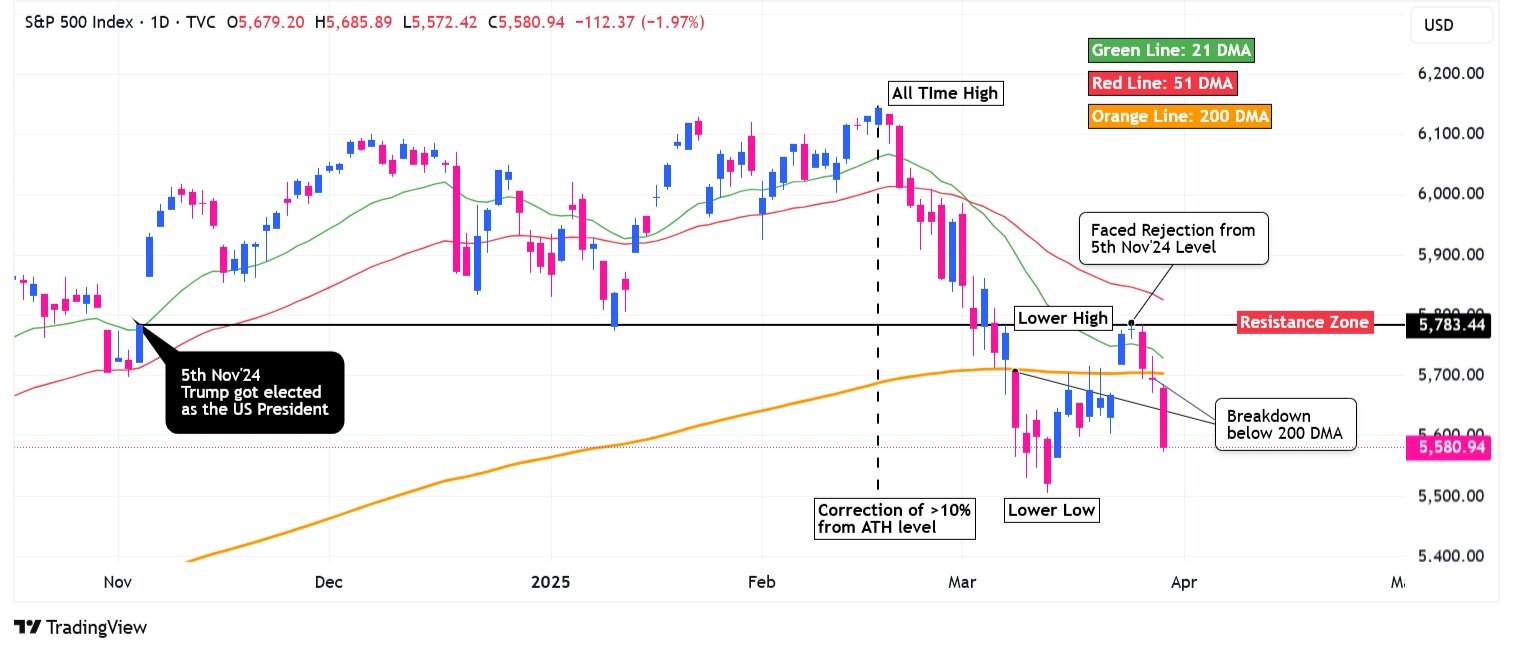
S&P500 Index: chart on ‘daily’ timeframe. (Source: TradingView)
Index tried to rally above 200 DMA, but faced rejection from 5th Nov’24 level. Thereafter, the charts have become weak as it breaks down below 200DMA, for the second time in the month of March’25. The low of 13th March is important support. Note: Index is still not in the bear phase, which only starts when correction is more than 20%. Currently, Index has corrected 9-10% from ATH.

Bitcoin Price Chart on ‘daily’ timeframe. (Source: TradingView)
The price breaks down below the 200DMA, for the 3rd time, as marked in the chart. This suggests persisting weakness. Even through the movement is similar to S&P500, the big shakeouts and wide spreads suggest higher volatility in Bitcoin. At the March month’s low, Bitcoin had corrected more than 25% from the ATH level. Will it again take support from 6th Nov’24 level (crucial support level)

US Dollar (DXY) Index: chart on ‘daily’ timeframe. (Source: TradingView)
During the week, DXY Index faced rejected from downward sloping 21 DMA (green line). Index is currently trading below its long term average (200 DMA). The immediate support level coincides with 5th Nov’24 level i.e. the start date of the rally in DXY after Trump won the US Presidential Election.
INDIAN INDICES

Nifty50 Index: Price Chart on ‘daily’ timeframe. (Source: TradingView)
Nifty re-tested it’s previous high level around 23800 (resistance), but could not close above that. That narrow range consolidation just above 200 DMA is yet to confirm the trend. Will it breakout or breakdown? We’ll see that in the coming week.

Nifty500 Index: price chart on ‘daily’ timeframe (Source: TradingView)
Index is currently trading below 200 DMA (orange line) after it faced rejection from its long term moving average. However, the Index has managed to trade above short/medium terms MAs -21 DMA & 50 DMA, respectively.

Nifty Midcap100 Index: Price Chart on ‘daily’ timeframe. (Source: TradingView)
Index is currently trading below 200 DMA (orange line) after it faced rejection from downward sloping long term moving average (200DMA). Index has managed to trade above short-term (21D) and medium-term (50D) MAs.

Nifty SmallCap100 Index: Price Chart on ‘daily’ timeframe. (Source: TradingView)
Index is currently trading below 200 DMA and slightly below 50 DMA also. Index has managed to trade above short-term 21 DMA.
MARKET BREADTH OF INDIAN STOCK MARKET

Market Breadth at the end of Week 13, 2025 (Source: ChartInk)
Stocks trading above 21DMA: reduced drastically during the week - from 70% on 24th March (i.e. Monday) to 43% on 28th March.
Daily Market Moves: look at the number of stocks ‘below 3%’ on section. The number was significantly high on 25th & 26th March, followed by more selling pressure on 27th & 28th March. What do you think would have happened on the charts? Squatting, profit booking and failed breakouts traps!
52 Week High/Low: the number of stocks making new 52W ‘lows’ was over powering during the week, indicating selling pressure and weakness in broader market.

Gold Futures (MCX): Price Chart on ‘daily’ timeframe. (Source: TradingView)
The Index breaks out from the recent consolidation of 1 month. The price action looks very bullish. Look closely how the index has consolidated before breaking out to higher territories. Gold Index has a history of outperformance during phases of high volatility in the global equity markets.
ACCESS RESTRICTED FOR MEMBERS ONLY
SECTORAL INDICES
sectors showing strength
sectoral rotation
WINNING STOCKS
leading stocks
technical analysis
swing/positional trading opportunities
STOCKS TO KEEP IN YOUR WATCHLIST
building a focussed watchlist
WHAT SHOULD A TRADER DO IN THIS MARKET SCENARIO?
“JOIN THE WAITLIST TO BECOME OUR PREMIUM MEMBER”