

DeepDive Week 6, 2025: Post Budget Rally running out of steam. RBI cuts policy rate by 0.25%. Gold outperforms Nifty.
Disclaimer: Information and resources shared on this website are only for educational and learning of our readers/members. They should never be interpreted as a buy/sell recommendation of any asset/stock. We encourage you to do your research and due diligence.

Market Breadth
The Union Budget’25 was announced on 1st February, last week, and market breadth saw marginal improvement as the Finance Minister boosted the sentiment of domestic growth drivers. This week opened with global fear amidst Donald Trump’s stance to impose higher tariffs on imports from Mexico, China and Canada. Consequently, the Indian Rupee depreciated to historical lows, as USD/INR hits 87 mark for the first time ever, with no signs of recovery, yet.
An important event happened during this week. RBI’s MPC Meeting, 2025.
The new RBI Governor, Mr. Sanjay Malhotra, has reduced the policy rate (repo rate) by 25bps i.e. 0.25% to 6.25%. This was the first rate cut in almost five years. The expected move by the RBI was to support Ms. Nirmala Sitharaman’s stance in the Union Budget’25 to increase liquidity and domestic demand. However, no future guidance was given on subsequent policy rate reduction.
We discussed about the Budget’25 in our previous post, click here to read about the highlights, the focus areas and the sectors that are likely to benefit from this Budget.
Let’s now dive into the data, and analyze the market breadth of the stock market.

Market Breadth at the end of Week 6, 2025. (Courtesy: ChartInk)
Stocks trading above 200DMA: has grown marginally from 32% to now 33%. For most stocks the long term average line (200DMA) is acting like resistance, since major indices are also trading below their long term averages. As traders, we need to see this number atleast cross the ‘50-60’ range, to indicate that the Bears are losing their grip.
Stocks trading above 21DMA: has nearly doubled, from 30% to now 35%. This is primarily because of the slight improvement in the sentiment after the two major events - Union Budget and RBI’s Policy Meeting.
Later in this post, we’ve discussed about the themes and sectors that are acting strong and resilient. As a Trader, all you need to focus on, are the stocks showing price strength. And then compare if the sector as a whole is also showing similar strength, or not. If yes, then comes your next task - to filter the ‘leaders’.
“Leading stocks are like Stethoscope. They help you monitor the health of the stock market. The first indication when the market comes out of a Bearish phase and starts a new Bull market rally, generally comes from these Leaders as they bottom-out first.”
Build a watchlist of these stocks, and wait for the green signal from the major indices. Let the Indices start trading above their long-term averages (200DMA) and even better when it trades above short-term averages (21DMA & 50DMA). That would confirm the trend, which is what you need to hike higher!
As per our Trading Rules, that are based on the experience of world’s legendary traders, when the major indices are trading below 200DMA, it is a NTZ (No Trade Zone) for swing/positional traders . We had discussed about this ‘Rule’ in our Weekly DeepDive post (to refresh your memory, click here).
Deep Dive into the Indices
Let’s examine the technical charts of our major Indices, and see if their weekly closing show any sign(s) of improvement, especially after the positive undertones set by the two major events - Union Budget and RBI’s rate cut. All clues are in the price action.
As a Trader, we don’t have to Speculate, you just have to REACT!
GREEN SHOOTS
Trader Hikes: Trader! Do we see any ‘GREEN SHOOTS’ to react?
Trader: Wait. What? Where can I find them?
Trader Hikes: When the Index is trading below key moving averages (long, medium, and short), ‘Green Shoot’ is like a ‘first sign’ of an attempt made by the Index to come out of Correction or Bear Market phase. As a Trader, you should wait patiently for this signal. You need a confirmation for the trend reversal i.e. when the market resumes the bull rally after correction or bearish phase. It’s all there in the price action. Look closely the charts of all major Indices. Wait. It’s not that easy and uniform, what follows the ‘green shoot’ day(s). Experience will teach you the rest! But there’re a few things you must keep a NOTE of:
Just like when a seed develops the ‘green shoot’, it may not always grow into a mature plant. Similarly, every ‘green shoot’ you see on technical chart of any Index/Stock, may not always be followed by a bull rally.
Sometimes, after the ‘green shoot’, the price
will exhaust soon and pullback, thus wiping all the gains;
while on other instances it will simply fail to create new lower lows i.e. resuming the downtrend (correction / bear market), thus trapping Long Traders under the garb of false positive i.e. ‘Fake Green Shoot(s)’..
This is a very sensitive area when the price is attempting to reverse its trend. This transition not to offers the best risk-reward setups to trade, but also helps you spot the ‘leaders’ and build a watchlist. However, an amateur trader may also get trapped when the Index gives a ‘fake green shoot’ day.
Now, ready to DeepDive into the Indices now? Let’s go.
Major Indices:
NIFTY50
NIFTY500
NIFTY MIDCAP
NIFTY SMALLCAP

Nifty50 Index: Price Chart on daily timeframe. (Source: TradingView). Currently trading marginally below 200DMA. Do you notice the day labelled as ‘Green Shoot’. That’s when Nifty50 reclaimed it’s 200DMA after 22 trading sessions, after the Union Budget was announced. However, after the rate cut by the RBI, Nifty closed marginally below 200DMA. Keep a very close eye here. See if next week has more ‘green shoot’ days.

Nifty500 Index: Price Chart on daily timeframe. (Source: TradingView). Currently trading below 200DMA. It hasn’t witnessed the ‘Green Shoot’ day, yet.

Nifty MidCap Index: Price Chart on daily timeframe. (Source: TradingView). Currently trading below 200DMA. It hasn’t witnessed the ‘Green Shoot’ day, yet.

Nifty SmallCap Index: Price Chart on daily timeframe. (Source: TradingView). Currently trading below all MAs - 200DMA, 50DMA and 21DMA. It looks quite weak on the charts, making LLs and LHs.
Sectoral Indices that closed ‘above’ 200DMA:
NIFTY FINANCIAL SERVICES
NIFTY IT
NIFTY CONSUMPTION
NIFTY AUTO
NIFTY PHARMA

Nifty Financial Services Index: Price Chart on daily timeframe. (Source: TradingView). Currently trading all key moving averages i.e 200DMA (yellow), 50DMA (red) , and 21DMA (blue). By far, the strongest looking sectoral index. Just keep an eye on its leading stocks!

Nifty IT Index: Price Chart on daily timeframe. (Source: TradingView). Currently trading above 200DMA. No progress since last week. Keep an eye on the narrow consolidation range. It can break it on either side.

Nifty Consumption Index: Price Chart on daily timeframe. (Source: TradingView). Currently trading marginally above 200DMA. It couldn’t sustain the reaction after the Budget Announcement. The low of the 1st February (Budget Day) candle is important.

Nifty Auto Index: Price Chart on daily timeframe. (Source: TradingView). Currently trading just above 200DMA. It needs to protect the low of 1st Feb (Budget Day), as well as 200DMA.

Nifty Pharma Index: Price Chart on daily timeframe. (Source: TradingView). Currently trading above its 200 DMA and 21DMA (blue). Significant improvement since last week when it close just at its 200DMA. Will it reclaim all the key MAs during the next week?
Sectoral Indices that closed ‘at/below’ 200DMA:
NIFTY BANK
NIFTY REALTY
NIFTY PSE
NIFTY FMCG
NIFTY PSU BANKS

Nifty Bank Index: Price Chart on daily timeframe. (Source: TradingView). Currently trading just at the 200DMA. Can you see a ‘double-bottom’ pattern? Let’s see if it can sustain above all its key MAs.

Nifty Realty Index: Price Chart on daily timeframe. (Source: TradingView). Currently trading below 200DMA. Looks like a ‘reverse head & shoulder’ pattern in the making. Confirmation will come only when it trades above 200DMA and other key MAs.

Nifty FMCG Index: Price Chart on daily timeframe. (Source: TradingView). Currently trading below 200DMA and all other MAs. After the Budget Announcement, it closed above 200DMA (last week). However, it couldn’t sustain. Squatted all the way back!

Nifty PSU Bank Index: Price Chart on daily timeframe. (Source: TradingView). Currently trading below 200DMA and other MAs. The technical chart looks weak! Improvement only starts above 200DMA.

Nifty Metal Index: Price Chart on daily timeframe. (Source: TradingView). Currently trading below 200DMA and other MAs. The technical chart looks weak, just like you saw in PSU Bank Index chart, above. Improvement only starts above 200DMA.

Nifty Energy Index: Price Chart on daily timeframe. (Source: TradingView). Currently trading below 200DMA and other MAs. It is one of the weakest looking sectoral charts. As a Trader, you have to stay away from such sectors, despite all the hyped news, bullish reports, credit rating upgrades etc. etc. Remember, we don’t bottom fish!
GOLD - where the real action is!
Gold is making new highs. During the week, it finally hits 85,000 mark. In last 2 weeks alone, this precious metal has gained about 6.2%. Do you know Gold has been outperforming NIFTY50 Index?
Let’s see the returns that Gold has given, as on date :
since 1st Jan’25: 10.6%
since 1st Jan’24: 34.2%
since 1st Jan’23: 54%
Let’s compare with NIFTY50 returns, during the same period:
since 1st Jan’25: (-)2%
since 1st Jan’24: 8.4%
since 1st Jan’23: 30%
Sheer outperformance by Gold vis-a-vis Nifty50. Isn’t it jaw dropping?
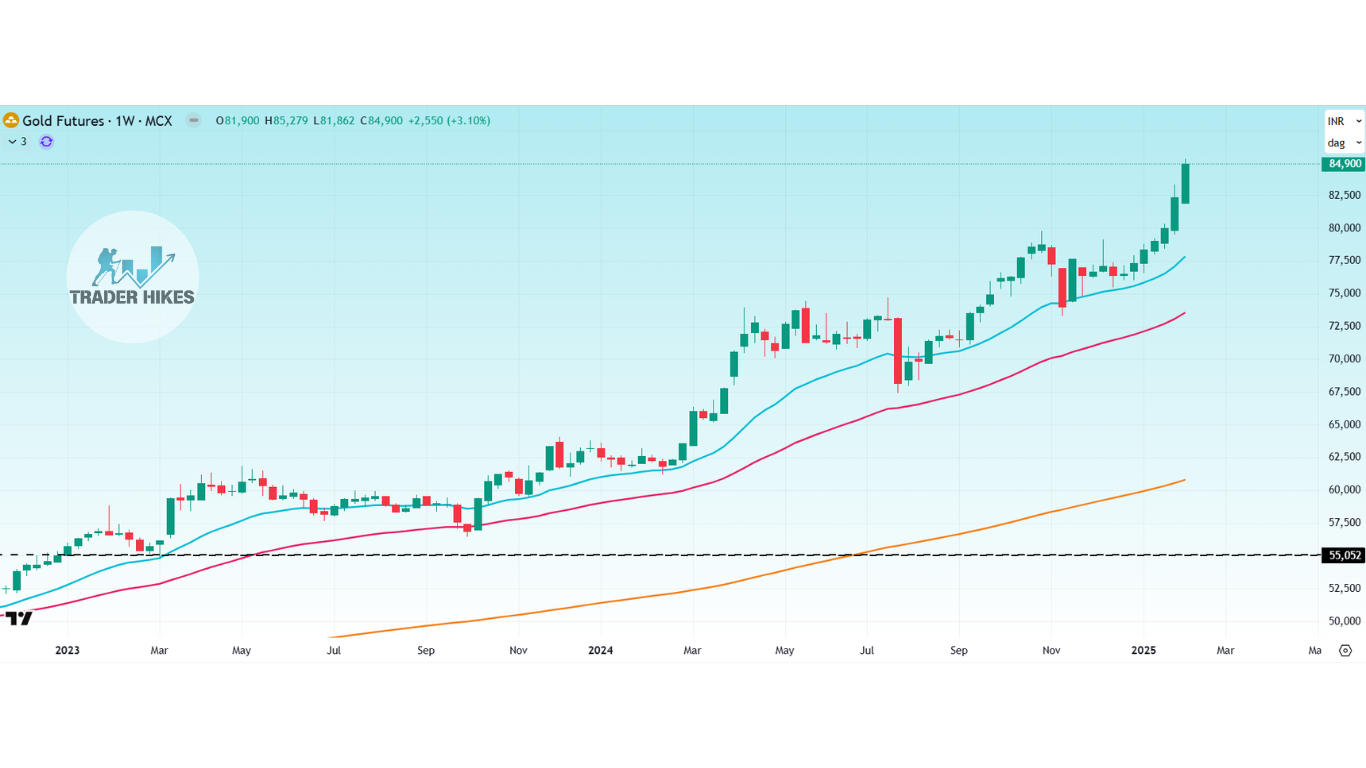
Gold Futures MCX: Price Chart on weekly timeframe. (Source: TradingView). This chart shows the massive rally in Gold prices since 2023, beginning. Will it hit the 1,00,000 mark?
HOMEWORK EXERCISE
As per Trader Hikes’ Rule (THR), no fresh trading position is to be initiated as long as major indices are trading below 200DMA. No sustained move is expected till then, rather it can do more damage by multiple chops. Risk Management is our priority!
Build your Watchlist of Stocks: Stay on the sidelines, and focus on building a watchlist of stocks. How can you find that?
Stock which are trading above 200DMA, preferably above 50DMA, are the ones where you should focus. When the Indices improve and resume the uptrend, these are the stocks that can likely give a solid runup.
Find leading stocks from leading sectors/themes. For clue, look for sectors trading above 200DMA, and find the top stocks from these sectors. Build a Watchlist.
If the major indices improve in coming week(s), you can likely find low risk-reward entries in these names from your watchlist. Always stay where strength is! Just wait for the overall environment to turn favorable, before you hike!
That’s a wrap! See you in the next week’s Deep Dive hike.
If you enjoyed reading this post, don’t forget to SHARE it with Trading enthusiasts like you! Let’s grow our community.