

DeepDive Week 3, 2025: Bears vs Bulls. Oversold Smallcaps & Midcaps looking to find a bottom. IT Index drags but Reliance wakes up!
Disclaimer: Information and resources shared on this website are only for educational and learning of our readers/members. They should never be interpreted as a buy/sell recommendation of any asset/stock. We encourage you to do your research and due diligence.

MARKET BREADTH

Market Breadth at the end of Week 3 (Courtesy: ChartInk)
The opening day of the Week 3, i.e. Monday (13th January) saw a sharp fall. Look at the image above. More than 1500 stocks tanked more than 3%. On Monday, only 8% stocks remained over 21D EMA and only 30% stocks were trading above the long term 200D moving average line. This was the lowest recorded number for during the entire month of January. The relentless selling by the FIIs took the indices to ‘extremely oversold’ zone. Such a scenario, is generally followed by a ‘Technical Bounce Back’. That is exactly what happened!
Next day i.e. on Tuesday, 722 stocks bounced back with > +3% gain, and 232 stocks moved > +5% gain. All the subsequent days till week’s close, saw higher number of stocks trading in ‘green’ zone. For a Trader, the data of understanding the Stock Market’s pulse becomes extremely important to plan your trading positions, and to find the winning stocks. We are here to train you to become a successful Trader, holistically, so don’t skip this part to jump to the Charts section. It is for a reason, we’ve kept ‘Market Breadth’ as the opening part of our Weekly DeepDive posts.
Don’t miss to read about how the market breadth has changed since the beginning of 2025. After reading them, you can come back to this post, for better clarity. To read our previous two ‘Weekly DeepDive’ blogs, click on the links below:
INDICES CHECKUP
Lets now jump from numerical data to price data. Where are the major Indices trading? Who has the upper hand, Bears or Bulls? What’s the outlook for the coming week?
Nifty50 Index ended with (-)0.97%, taking it from 23430 (last week close) to 23391 level, now. Nifty is still trading below the 200D SMA, i.e. in the BEARISH ZONE. However, interestingly, look at the chart on ‘weekly’ timeframe (below). The ‘Doji' candle formed on weekly charts, is the first sign of likely reversal in the trend. It suggests that the Bears were not able to drag the index lower, as they were confronted with the buying strength of Bulls. Hence, the Doji candle. Note that Doji candle does not confirm the reversal in trend. Rather it is one of the indication of the likely reversal in the trend. The follow-through week(s) will confirm the real trend for the indices.

Nifty50 ‘Weekly’ Price Chart since 2024 (Source: TradingView). Note the ‘doji’ candle formed on the weekly charts.
Nifty50 Top Losers of the Week:
In the previous ‘DeepDive Week2’ blog, we noticed that Nifty IT index outperformed with positive outlook by TCS. However, this week, the tables turned completely. Most of the stocks that were top Nifty50 gainers last week, became the top losers this week. IT Index was the worse performer during the week. All the credit goes to muted Q3 results and poor guidance by the tech giants. Look at the weekly price fall in some of the IT giants:
HCL: -10.3%
Infosys: -7.7%
Wipro: -6.2%
LTIM: -3.9%
TCS: -3.3%
Look at their technical charts:


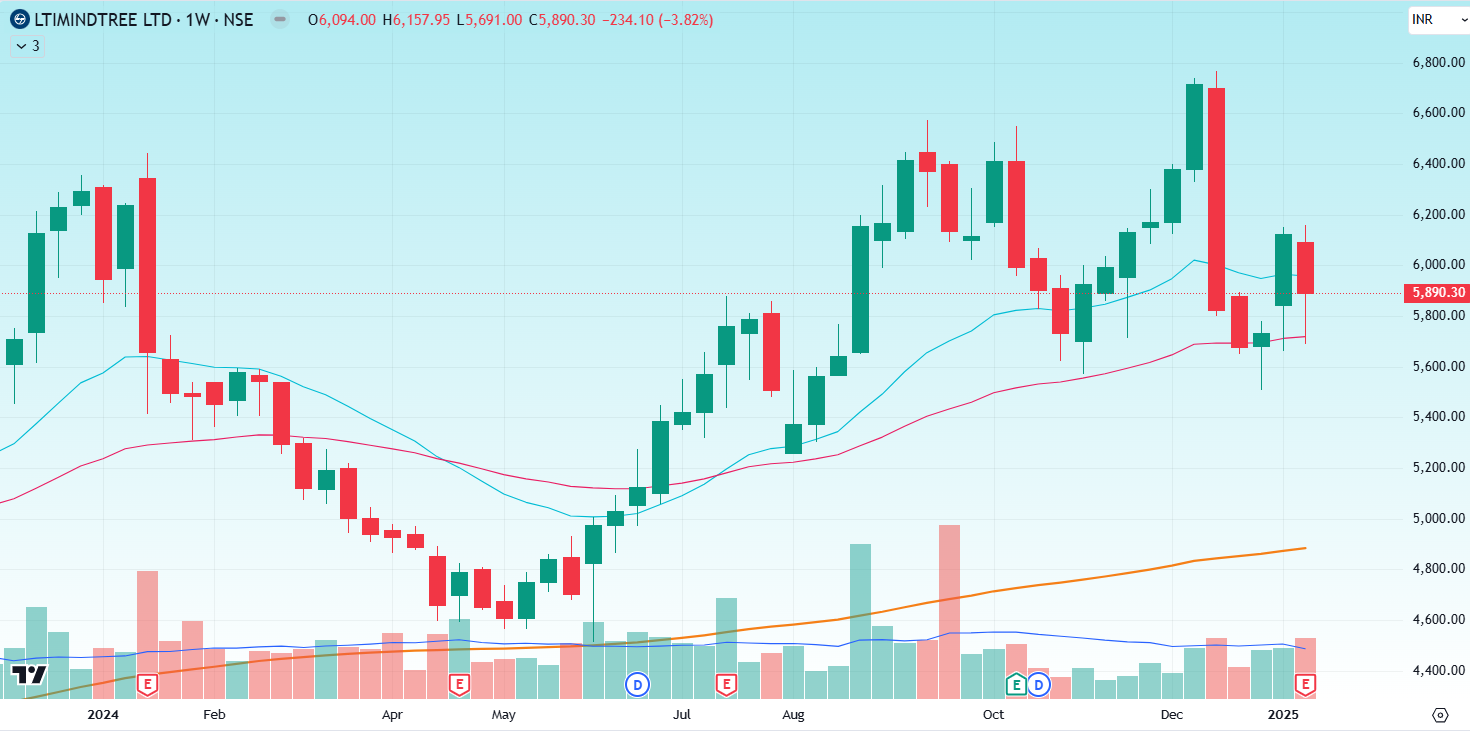


Source: Trading View
Who says bluechip stocks are less volatile? Any bad news during the weak/bearish sentiment can be brutally punished by the stock market. While, any good news may still not be rewarded equally. Therefore, a Trader should remain extremely cautious during such a phases in market.
Nifty50 Top Gainers of the Week:
Remember we talked about ‘silver lining’ in the previous blog. For this week, it was Reliance Industries, that finally woke up from its hibernation and ended the week with +4.9% (beats the estimates with Q3 results). The weak Q3 result show by heavyweight IT & Banking stocks, till week 3, can be only be replaced by strength in the technical charts of Reliance Industries. A continued upward price trend in Reliance (i.e. price creating a higher highs, and higher lows), and reclamation of its 200D moving average line (‘yellow’ line in chart below), will confirm the stock’s bottom formation. A follow through week is needed. That would be a big big positive for Nifty to resume its uptrend. All eyes on Reliance in the coming week!

Daily Price Chart: Reliance Industries (Source: TradingView).
Some of the other top Nifty50 gainers:
Hindalco: +7.4%
NTPC: +5.8%
HDFC Life: +5.5%
Coal India: +5.2%
Adani Port: +4.6%
Adani Group stocks and the PSU Stocks showed a positive price move during the week. Another pillar of strength was the Insurance Sector with HDFC Life posting great Q3 numbers during the week. The entire Insurance sector has a lot of value unlocking left, and if other stocks post similar strong growth numbers, it is quite likely that we can see a strong price rally here once the indices resume its uptrend. A trader should always build the watchlist around names that are positing strong growth numbers in the weak market sentiment. These are the pockets where Institutions are interested, as a new rally is generally thrusted by new emerging names & themes. So, keep an eye on Insurance stocks!
‘CHOTA PACKET BADA DHAMAAKA’ STOCKS: TOP PERFORMING MICRO, SMALL & MID CAPS STOCKS
AMAL: +40% price up move
it is a micro-cap company doing the business of bulk chemical manufacturing. In Q3, Amal recorded a sales growth of 77% YoY with a massive 630% jump in Net Profits The operating profit margin saw a significant improvement too. As a reaction, stock price move over 40% during the week.

Weekly Price Chart of Amal Ltd. (Source: TradingView)
AEROFLEX INDUSTRIES: +29% price up move
is a recently listed smallcap IPO stock. The company is engaged in the business of metallic flexible flow solutions like: stainless steel hoses, composite hoses and assembly & fittings. Stock price moved +29% during the week after posting fabulous set of numbers. Sales grew by 33% and the PAT grew by 64%. There’s a change in demand from plastic/pvc pipes to now metallic braided/unbraided hoses. It is an interesting space to deepdive for an investor as well as positional trader.

Weekly Price Chart of Aeroflex Industries (Source: Trading View)
However, both the stocks are currently extended on the technical charts. They need to build some base to keep the trend going higher. These are the pockets that should catch the eyes of the Traders. Never chase stocks at higher levels, wait for a ‘low-risk’ entry before buying a momentum/growth stock. Remember, it is not just about the return, it is about the risk too. Your ‘risk:reward ratio’ should be favourable, at the time of initiating any new trade.
ANTI-GRAVITY STOCK

Technical Price Chart: BSE Ltd. (Source: TradingView)
BSE Ltd. is one of the most powerful stock from the Midcap space. During this week, it has given a +17% price up move. Look in the above weekly price chart of BSE, it reversed from 10 weekly EMA, breaking out above the 4 week pullback in this week. Don’t forget the weak market sentiment that still persists. Major indices are still trading below their long term averages. The stock, since its breakout in September’24, above 2800 price levels, has given more than 100% plus upside move (in under 4 months). Every time you’d thought it looked extended on charts, it proved you wrong. Isn’t it?
Do a homework exercise! Study the chart of BSE on ‘daily’ as well as ‘weekly’ timeframe since March’23. Also study the fundamental quarterly results of BSE since Q1FY24. Believe you, me, there’s a lot to learn from the price action of this winning growth stock! Don’t skip these exercises as they are extremely important to revisit charts and spot - buy entries, profit booking levels, and sell violations. Doesn’t matter if you traded this stock previously or not, what matters is if you had an opportunity, how well you could have handled your trading position(s). See if you find a similar price resilience on any other stock’s technical chart. Keep building a watchlist of stocks that show near similar price patterns and strength.
We are already in the Q3 result season, it will be exciting to find how many companies are able to surprise the market with solid fundamental numbers. Very interesting week ahead. Keep an eye on such surprising results. We will see you next with ‘DeepDive Week 4’!