

DeepDive Week 4, 2025: Bears in power. No Trade Zone for the Bulls. All eyes on the upcoming Union Budget’25.
Disclaimer: Information and resources shared on this website are only for educational and learning of our readers/members. They should never be interpreted as a buy/sell recommendation of any asset/stock. We encourage you to do your research and due diligence.
Market Breadth
Pessimism is not just in the charts, but is in the tone of the Traders. Weak market sentiments and the bleeding SmallCaps and MidCaps have become the talk of the town. Every person, new articles and social media posts have a bearish undertone. SIPs inflows have reduced, and it’s redemption has increased. Look at the Market Breadth image below. Less than 15% stocks trade above 21DMA (21 days moving average is short term MA), whereas stocks trading above 200DMA (long term MA) is around 30%. It means majority of the stocks are trading in ‘No-Trade Zone’ as they are below 200DMA.

Market Breadth at the end of Week 4, 2025. (Courtesy: ChartInk)
Trading Rule: No Positional or Swing Trade below 200DMA
When a Stock is trading below 200DMA, it has underlying weakness in price action. This can either be because of weakness in the indices or its fundamentals. Nothing good happens in a stock when it trades below 200DMA, rather it only gets worse with more time it spends in this zone. Stocks can remain below 200DMA for a very very long time, any wrong move can keep make you (trader) become a ‘forced investor’. Stay away from such names, track them and let them prove their worth to be a part of your trading portfolio.
When the major Indices trade below 200DMA, there is lack of liquidity in the overall market. It’s a hostile environment, as even small selling can cause drastic price correction in stocks. As Indices spend more time below 200DMA, things turn more ugly. Volatile swings (wild price moves, up and down) are a common feature in this zone. It can happen intraday, or on day-to-day basis. Only very experienced day-traders can take advantage of such swings from oversold levels till resistance pivots. They can be very fast, and slight delay can do great harm to your capital. Not to mention the mental burnout it can cause, if you try to act smart and trade long in such a bearish environment. Even strongest names can witness freefall. Therefore, as per ‘Trader Hikes Rule’, a trader should stay calm and avoid trading when major indices (Nifty, Sensex, Nifty Midcap, Nifty Smallcap etc.) are trading below 200DMA. Wait for the Indices to reclaim 200DMA, and let the trend resume. Till then, stay in cash and build your watchlist of stocks that are showing strength!
“Trading in stocks below their 200DMA, is like hiking on Avalanche prone snow mountain. An inch of movement can trigger the whole ice slab to fall, burying you under 50ft ice.”
What do the dream destination for any hiker? Mt. Everest.
Unlike, Mt. Everest, there is no top in stock market’s journey. Think of yourself as a ‘hiker’, embarking on an ultimate Trading Hike. It is only you who will decide the altitude of this hike i.e. how far you want to take your portfolio returns. Therefore, consider every financial year as an individual Trading hike to give your best performance, something similar to reaching the top of Mt. Everest.
For that, every move has to be a calculated move. Imagine you have made significant progress in reaching the top of Mt. Everest, but suddenly the weather turns pretty bad. What will you do? Will you stop hiking and look for a safe shelter until the weather improves, or will you keep making futile attempt to climb more by putting your life at risk?
An experienced Hiker will choose the first option, without a second thought.
That’s exactly where we are right now. Nifty was trading at extended territory, close to 26,000 level, during end of September’24. Quite likely everyone was siting on good portfolio gains. In a week, Nifty closed below its 50DMA, and in a month, it tested its 200DMA. Finally, after 3 months (Jan’25), Nifty has been trading below 200DMA for straight two week. Compare the example above. In this scenario, will you sit on cash (safe shelter) and wait for the market conditions to improve, or will you put your portfolio capital at risk and make futile attempts to earn back your eroded gains?

Nifty50 Price Chart on ‘daily’ timeframe (Source: TradingView). Note the exponential moving averages (EMAs) - Green (21DMA), Red (50DMA), Yellow (200DMA).
An experienced Trader will simple sit on ‘cash’ when the stock market’s indices are trading below 200DMA. If you learn this, you can be among the few who are able to finally deliver super-performance, and protect it. Siting on cash when the sentiment is bearish has many benefits:
you can prevent your mental drain and stay stress-free;
you have cash ready to be deployed when the market confirms its uptrend;
you can analyze things in the market with more clarity and take better decisions, without any attached bias.
For new traders, it can be shocking to learn how quickly market can evaporate the gains accumulated over months. This is why risk management is the key to successful trade in stock market. You should know when to put your foot on the pedal, and when to take it off. Put it in your brain, that “no trade is also a trade”.
Don’t miss to read about how the market breadth has changed since the beginning of 2025. After reading them, you can come back to this post, for better clarity. To read our previous two ‘Weekly DeepDive’ blogs, click on the respective links below:
Indices Checkup
Now since you have learnt the ‘No Trade Rule below 200DMA’, hopefully, let us take a quick glance at the levels where the major Indices are trading. This should give you more clarity about the rule, and where to focus more when things improve in coming week/months. All clues are in the price action. Look at charts below carefully.

Nifty500 Index: Price Chart on daily timeframe. (Source: TradingView). Currently trading below 200DMA.

Nifty Bank Index: Price Chart on daily timeframe. (Source: TradingView). Currently trading below 200DMA.

Nifty Auto Index: Price Chart on daily timeframe. (Source: TradingView). Currently trading below 200DMA.
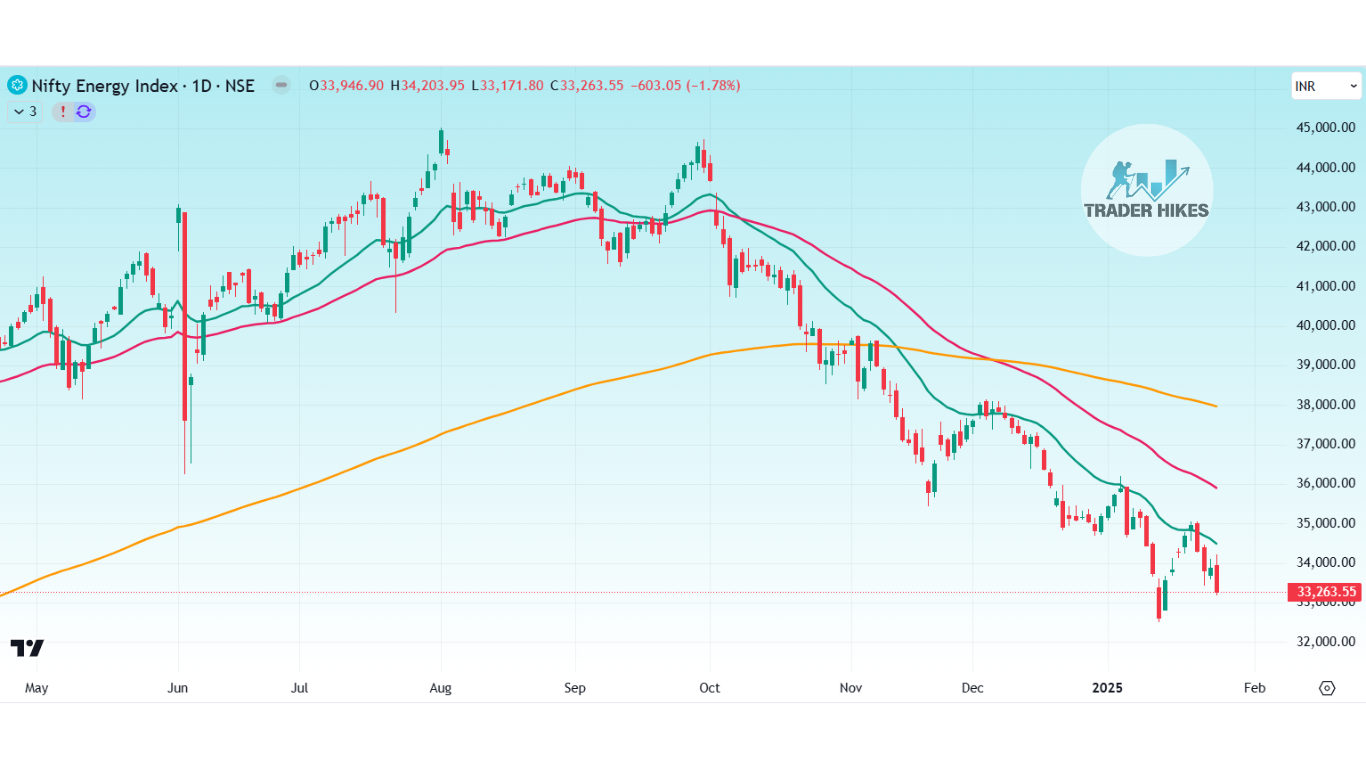
Nifty Energy Index: Price Chart on daily timeframe. (Source: TradingView). Currently trading below 200DMA.

Nifty FMCG Index: Price Chart on daily timeframe. (Source: TradingView). Currently trading below 200DMA.

Nifty Realty Index: Price Chart on daily timeframe. (Source: TradingView). Currently trading below 200DMA. Look at the sharp fall below 200DMA.

Nifty Metal Index: Price Chart on daily timeframe. (Source: TradingView). Currently trading below 200DMA.
There are just 2 Indices that are managing to stay above their 200DMA:
Nifty IT Index
Nifty Pharma Index
These Indices should be on your radar, and the leading stocks from these sectors should be on your Watchlist. As per Trader Hikes Rule (THR), no fresh trading position is to be initiated as long as Nifty50 & Nifty500 trades below 200DMA. No sustained move is expected till then, as we need strength from broader market to take the leading stocks from these sectors to higher highs. For the right entry, markets should be in a confirmed uptrend.

Nifty IT Index: Price Chart on daily timeframe. (Source: TradingView). Currently trading above 200DMA & 50DMA. This is clear display of strength.

Nifty Pharma Index: Price Chart on daily timeframe. (Source: TradingView). Currently trading above 200DMA, however below 50DMA. Need to be watchful here.
TECHNICAL CHARTS OF STOCKS
Since we are currently in ‘No-Trade Zone’, we have purposefully skipped to look at the technical charts of stocks.
As the we’re in the Q3FY25 result season, there’s a HOMEWORK EXERCISE for you. Look at the recent results of stocks and create a watchlist of companies posting solid Q3FY25 results. Look at the technical charts of those stocks and find out if they are showing price strength. How can you find that?
Hint: Stock which are trading above 200DMA, preferably above 50DMA, are the ones where you should focus. When the Indices improve and resume the uptrend, these are the stocks that can likely give a solid runup.
Upcoming Event: Union Budget’25 to be announced on Saturday i.e. 1st February.
We will look at the stocks and their price action in the next weekly DeepDive post, after the next week’s most awaited event. Yes, the Union Budget 2025! It will be released on Saturday (1st February), and the stocks markets will be open, as an exception, and will operate on usual timings. Markets may remain volatile till then, therefore it is better to stay on the sidelines to prevent any hit to the portfolio. Will the Budget surprise the market with any good news? Let’s find that out on Saturday and in our next post. All eyes on the Union Budget!